
Your turbine fleet, live — and an API for all of it.
A single, always-on window into every unit we manage — real-time telemetry, reporting, and fleet planning from any browser. And uniquely to Evolution: a full data API so every generator's data can flow straight into your own systems.
Stop waiting on phone calls to know if your equipment is running.
Evolution's SCADA platform gives you a single, always-on view of your natural gas turbine units — whether you're managing one site or an entire fleet. The moment something changes, you see it. Built specifically for our turbine fleet, it surfaces the data that matters to operators, site managers, and stakeholders, all from a clean web interface accessible from anywhere.
A full API for every generator we manage.
Most providers lock your data inside their dashboard. We don't. Evolution exposes a secure, documented data API so the same live and historical telemetry you see on screen can flow directly into your own systems — no manual exports, no copy-paste, no waiting.
- Pull live power output, status, fuel, temperatures & alarms programmatically
- Feed your BI tools, historians, dashboards & ESG/emissions reporting
- Query historical data by unit and date range for analysis
- Secure, authenticated access scoped to your units
# Request live data for a unit
GET /api/v1/units/SN593/telemetry

# Response
{
  "unit": "SN593",
  "model": "NGT18",
  "status": "running",
  "power_kwe": 173.1,
  "fuel": "natural_gas",
  "temp_c": 612,
  "alarms": [],
  "next_pm": "2026-09-14",
  "updated": "2026-06-05T08:44:34Z"
}
Illustrative example. Endpoints and fields are documented on access.
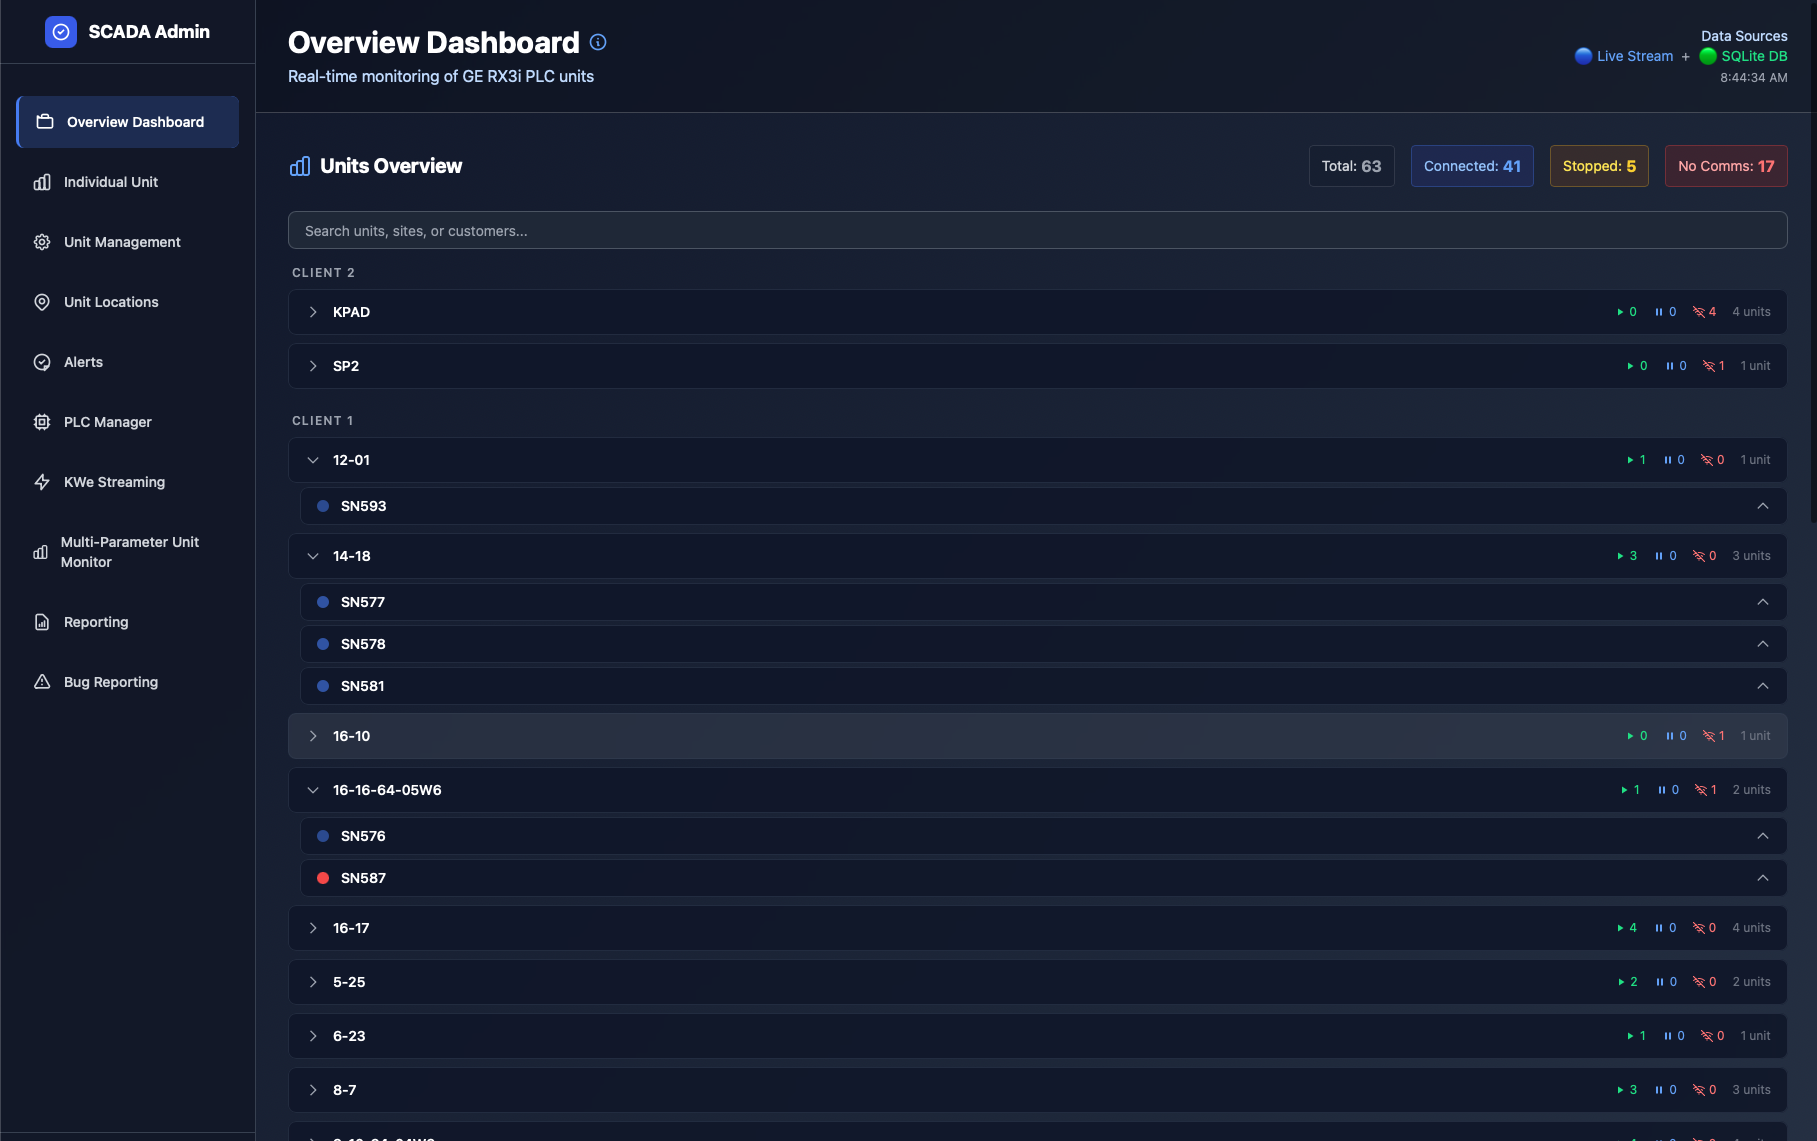
Your fleet at a glance, the moment you log in.
Every unit is listed with its current operating status — running, stopped, alarming, or offline — updated in real time. At-a-glance indicators show which units are healthy, which are stopped but connected, and which need attention. If a unit is in an active alarm, the alarm name appears right beside it, so you know the issue immediately without digging.
- Live status for every unit and site
- Active alarm names surfaced inline
- Unit model shown for easy identification
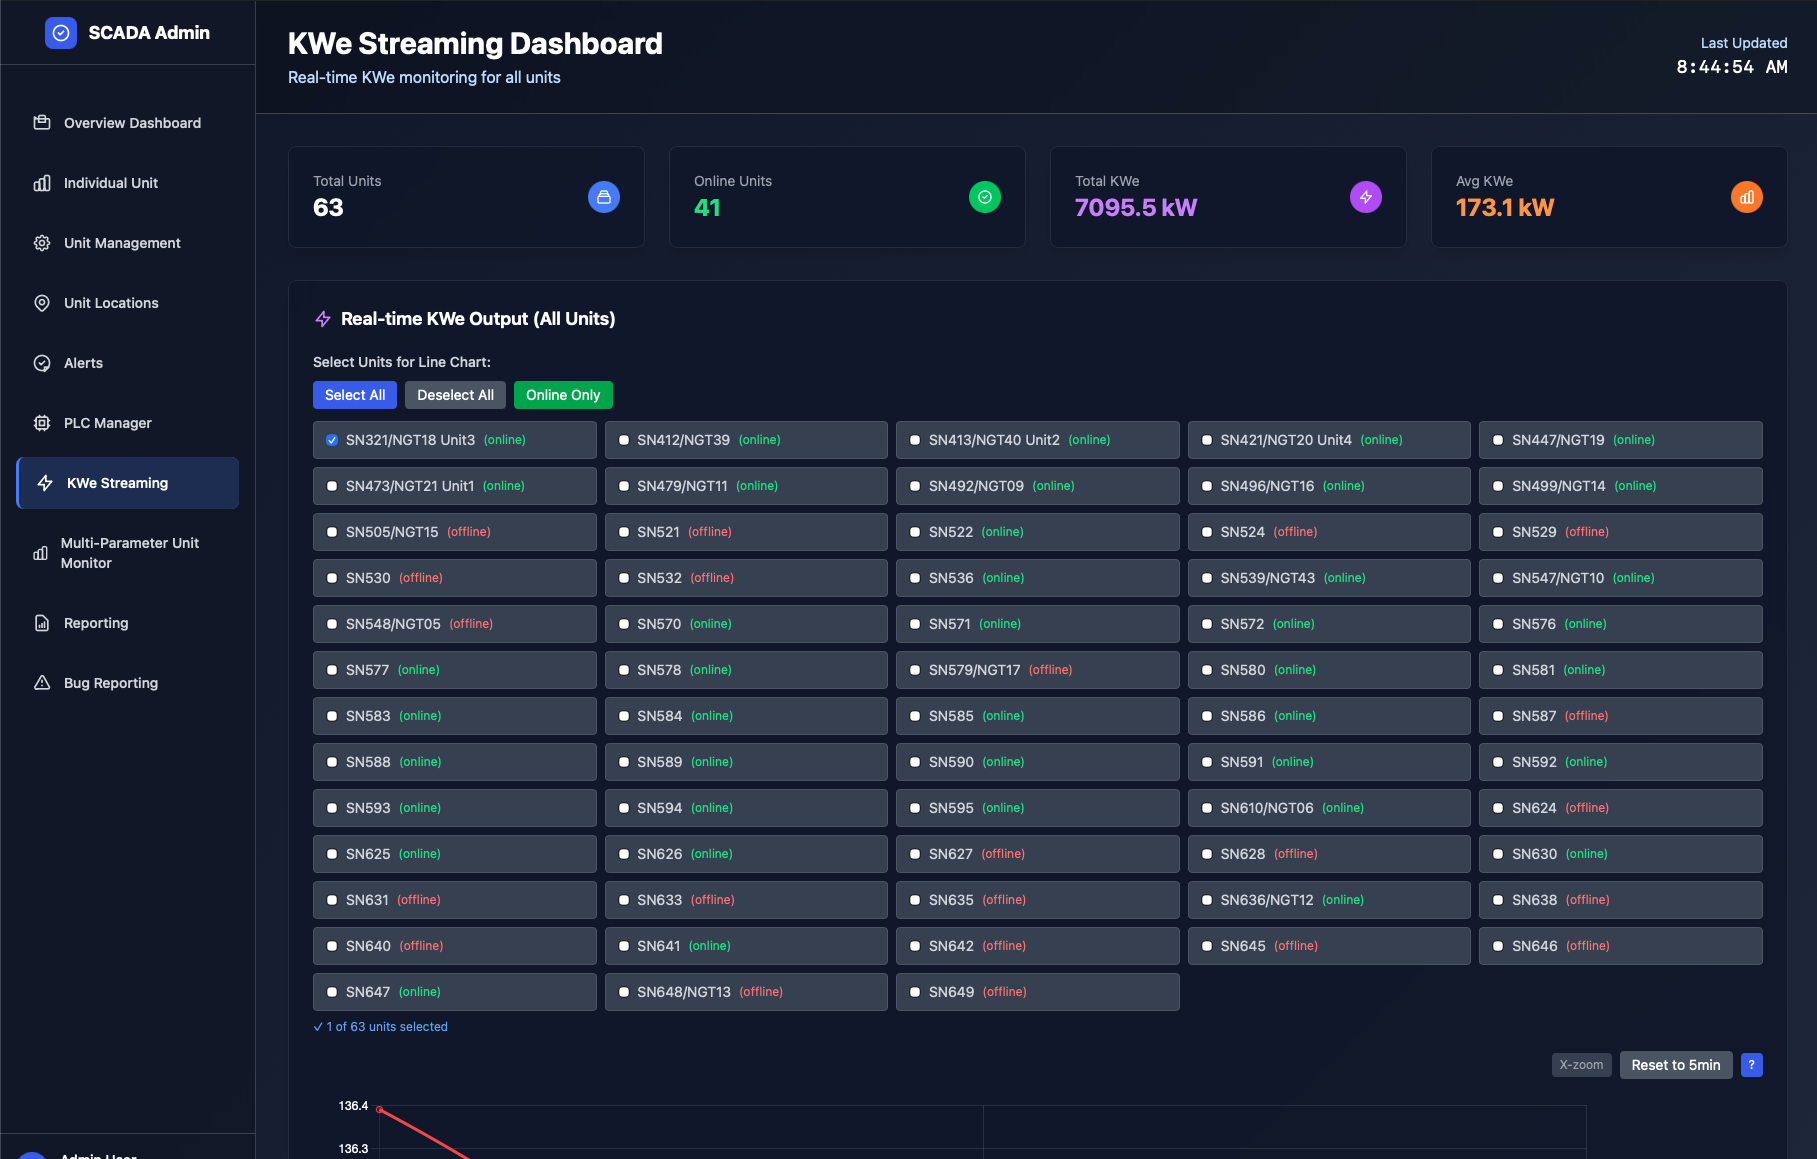
Go deep on any single unit.
Each unit has its own page showing live telemetry pulled directly from the machine over Modbus — power output, operating state, fuel consumption, temperatures and more — alongside its running history. You see exactly how it's performing at any moment.
The estimated date of the next scheduled maintenance is derived from the 8,000-hour service interval and adjusted for actual run time — so you always know how far away the next PM is, without tracking it manually.
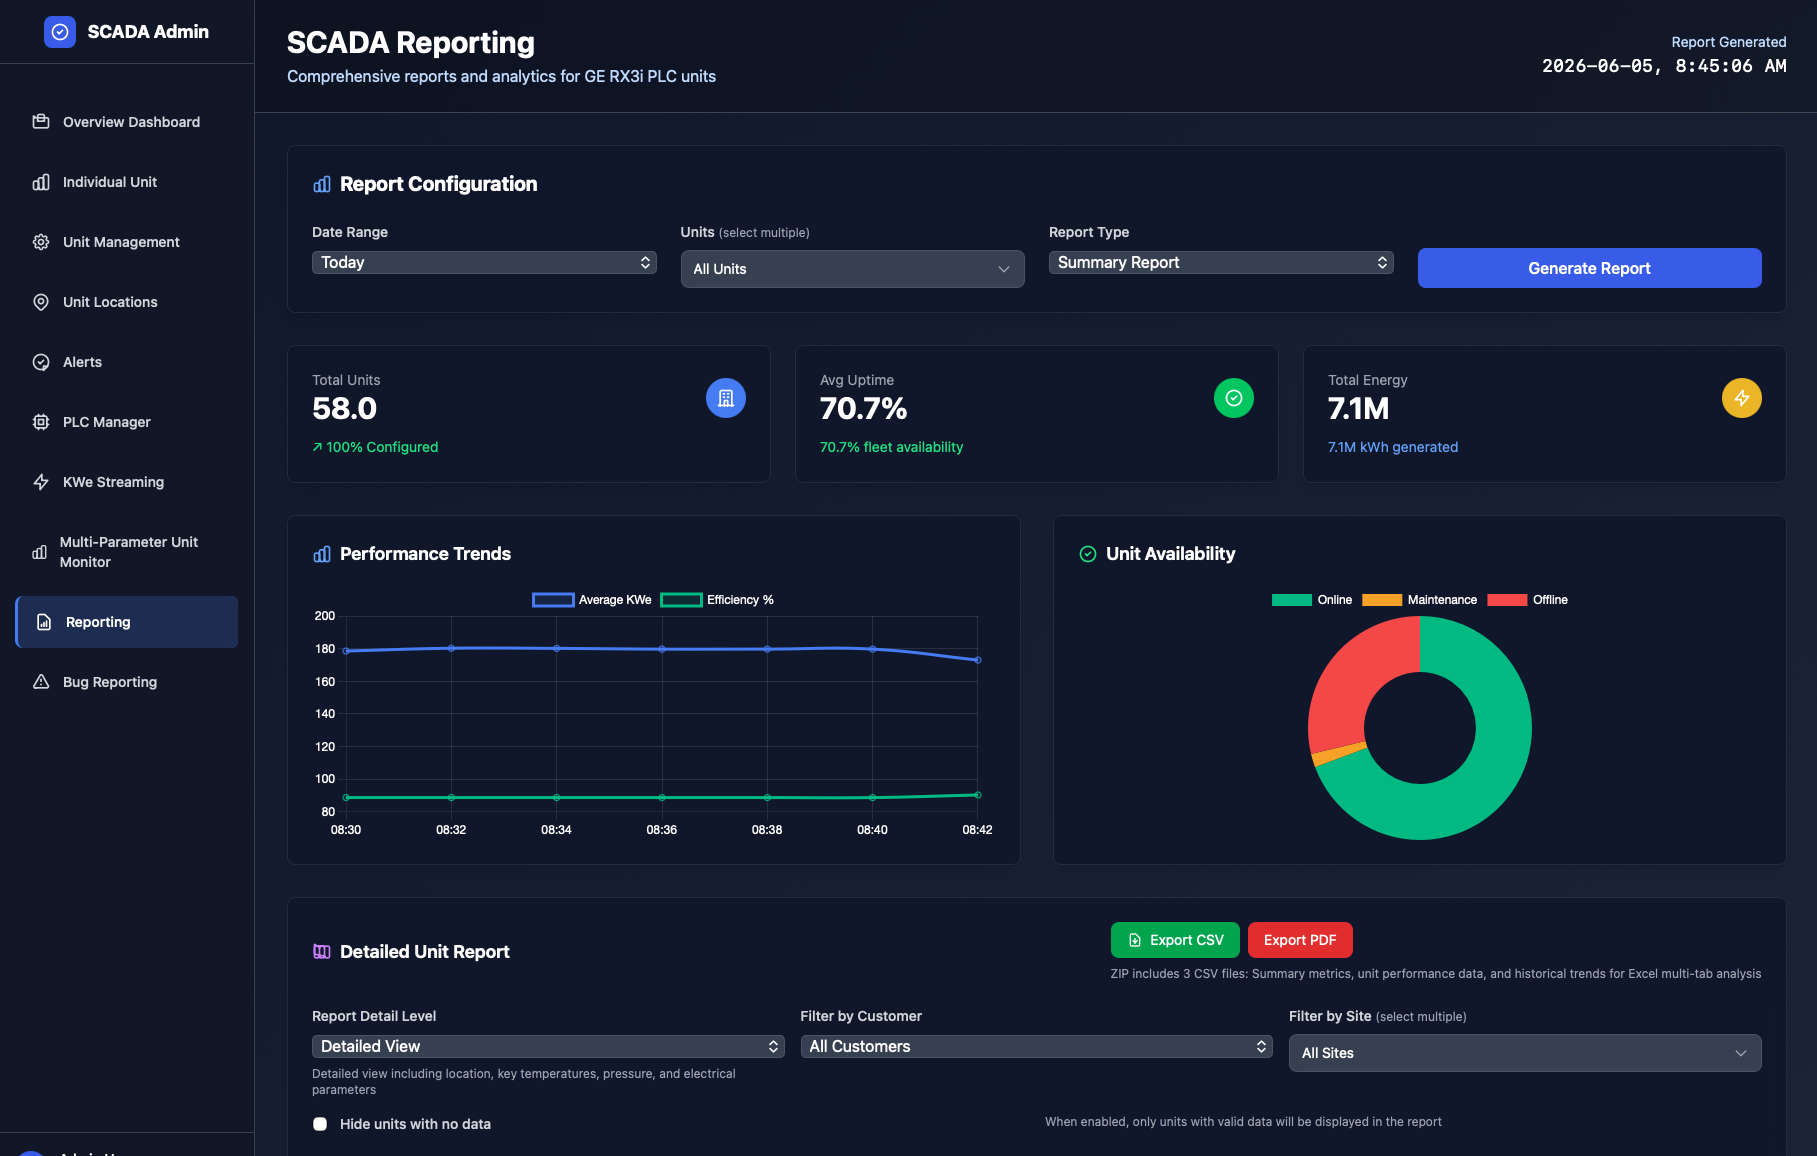
The data behind every billing cycle.
Access historical performance for any unit over any date range. Charts show power output over time — including average KWe and peak KW Max — alongside average fuel consumption and ambient temperature. For propane-fueled units, the temperature overlay shows directly how ambient conditions affect fuel burn.
- Power, fuel & temperature over any date range
- Export to PDF or download CSV for deeper analysis
- Charts shown inline — no download required to view
Forward planning, not just live monitoring.
A rolling 18-month visual calendar shows every unit's scheduled activity across the fleet — planned maintenance windows, standby deployments, active rental periods, and availability gaps. Staff can drag to create scheduling bars, assign them to clients, and annotate them with notes.
- Rolling 18-month fleet timeline
- Coordinate maintenance around rental commitments
- Auto-updates as units are added or changed
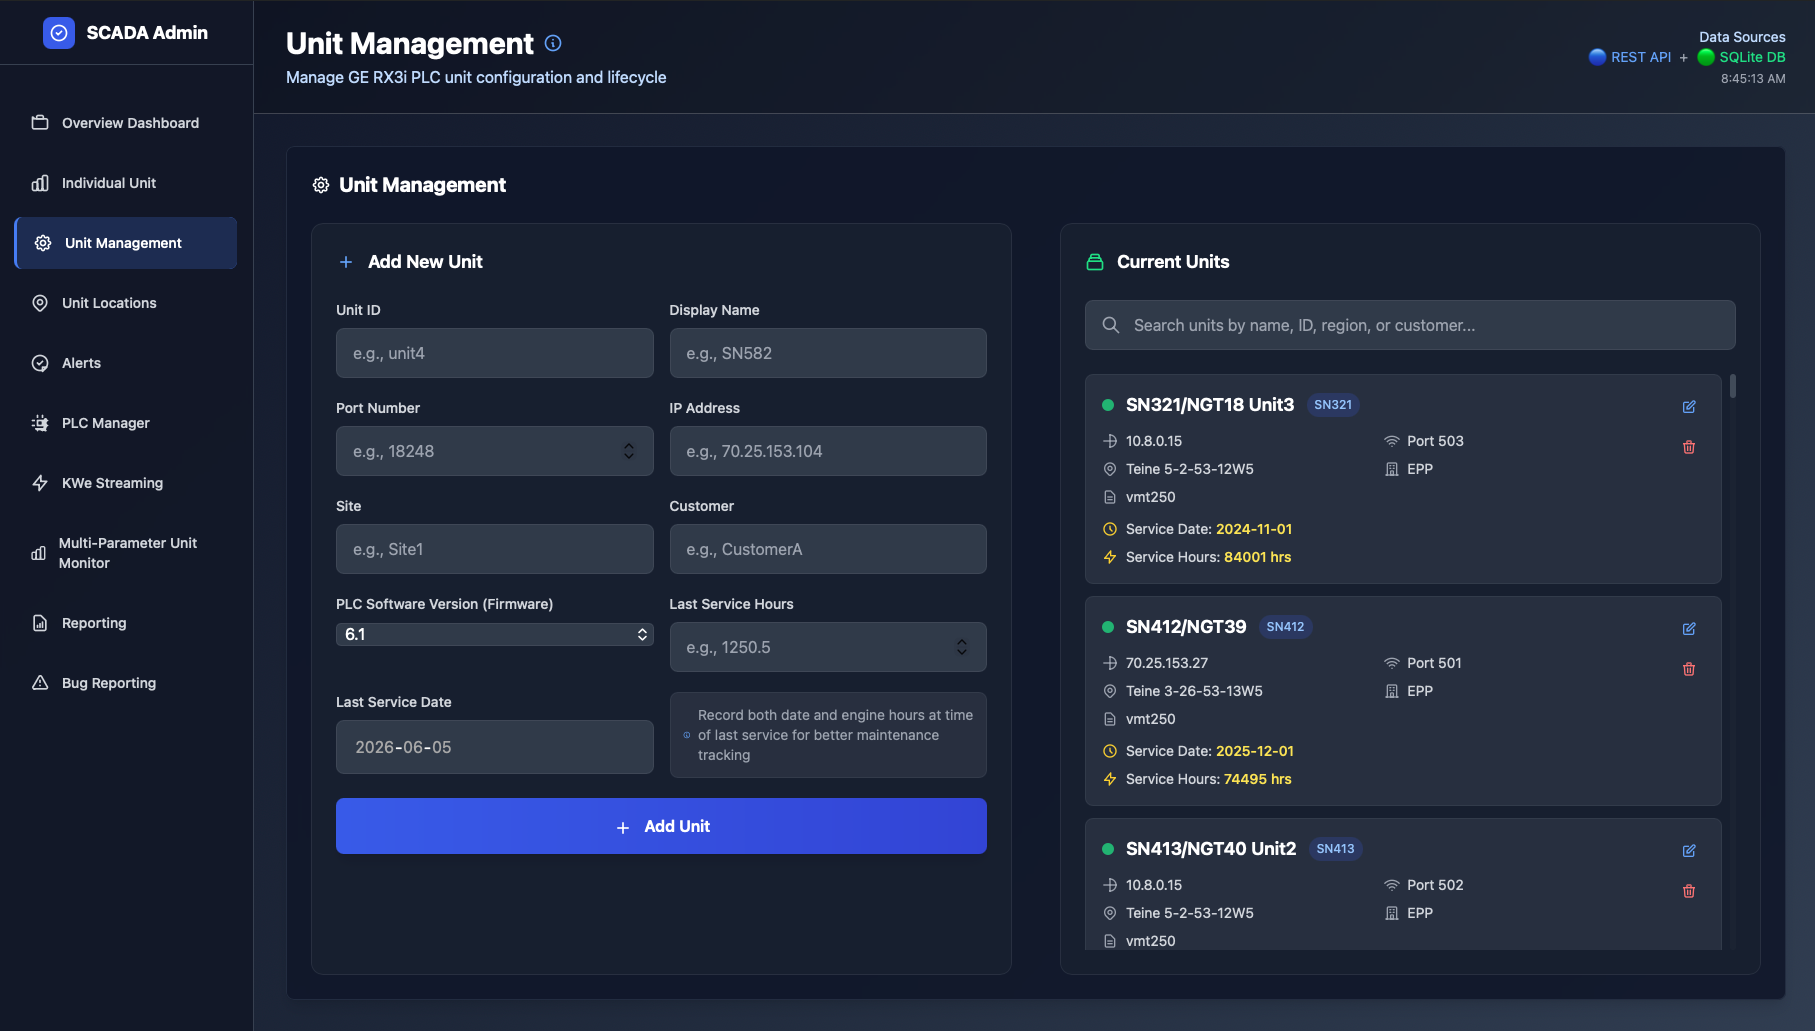
A reliable record, always available.
Full audit trail
Every change is logged — who did what and when — for billing, compliance, or internal review.
Continuous capture
Data is captured continuously and stored in a structured database — not just today's snapshot.
Long-term retention
Historical reporting is retained across multiple time periods, so the record is always there.
Log in from any browser.
The client portal lives at scada.evolutionps.ca/client-login. Your credentials give you reporting and visibility for your specific units. No software to install — it runs in a standard web browser.
Power you can see — and data you can build on.
Every Evolution deployment includes the SCADA platform. Ask us about API access for your units.